FillStyle
Modified in version 5.0
FillStyle ( seriesIndex ; color ; colorVariant ; color2 ; colorVariant2 ; . . . ; . . . ; color100 ; colorVariant100 )
| Argument | Type | Range | Default | Note |
|---|---|---|---|---|
| seriesIndex | int | 0..10000 | all | |
| color | rgba | 0..255 | (see desc.) | |
| colorVariant | int | -1..128 | solid | |
| color2 | rgba | 0..255 | (see desc.) | For Gantt charts only. |
| colorVariant2 | int | -1..128 | solid | For Gantt charts only. |
| ... | rgba | 0..255 | (see desc.) | For Gantt charts only. |
| ... | int | -1..128 | solid | For Gantt charts only. |
| color100 | rgba | 0..255 | (see desc.) | For Gantt charts only. |
| colorVariant100 | int | -1..128 | solid | For Gantt charts only. |
Description
By using the FillStyle() function, each data series can be assigned a separate fill color. Series, which are not explicitly assigned a fill style, are represented in one of the default fill colors, i.e. FillColorScheme(classic).
| | FILL_STYLE_01 |
| 1 | OpenDrawing(250;150) |
| 2 | ChartData(3.8; 2.8; 2.2; 1.6; 0.9) |
| 3 | BarChart() |
| 4 | /* Set up styles. */ |
| 5 | |
| 6 | |
| 7 | |
| 8 | |
| 9 | |
| 10 | |
| 11 | BorderStyle(1;;1;red) |
| 12 | BorderStyle(2;;1;gray) |
| 13 | /* Set up axes. */ |
| 14 | |
| 15 | AxisMajorTicks(all;0) |
| 16 | /* Set up grid. */ |
| 17 | MajorGridLineWidths(x;y;0.25) |
| 18 | MajorGridLineWidths(y;x;0) |
| 19 |

| | FILL_STYLE_02 |
| 1 | OpenDrawing(200;200) |
| 2 | ChartData(35 23 13 9 5 3) |
| 3 | |
| 4 | /* Set up styles. */ |
| 5 | |
| 6 | |
| 7 | |
| 8 | |
| 9 | |
| 10 | |
| 11 | BorderStyle(all;;1;#888) |
| 12 | LabelStyle(1;Verdana;10;plain;#333) |
| 13 |
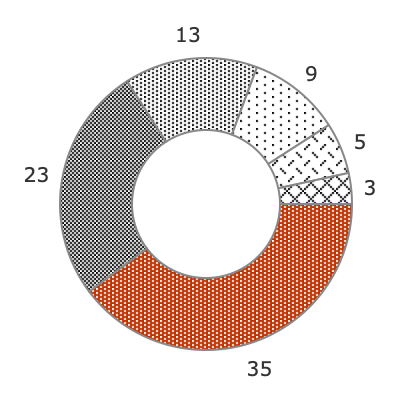
If no series index is defined or if seriesIndex = all is set, all series are assigned the same fill style.
| | FILL_STYLE_03 |
| 1 | OpenDrawing(200;200) |
| 2 | ChartData(35 23 13 9 5 3) |
| 3 | |
| 4 | /* Set up styles. */ |
| 5 | |
| 6 | BorderStyle(all;;1;#888) |
| 7 | LabelStyle(1;Verdana;10;plain;#333) |
| 8 |

Starting with xmCHART 5 it is possible to assign an individual fill color to each partial task of a GanttChart() . For example:
FillStyle(2;red;solid; /* Partial task 1 of series 2, fill color: red. */
green;solid; /* Partial task 2 of series 2, fill color: green. */
blue;shaded) /* Partial task 3 of series 2, fill color: shaded blue. */
The additional color;colorVariant arguments in function FillStyle() are available only for Gantt charts and are ignored in combination with other chart types. All other style functions such as BorderStyle() , LabelStyle() , etc. have not been modified.
| | FILL_STYLE_04 |
| 1 | OpenDrawing(250;150) |
| 2 | ChartData( 0 24 38 62 76 100; |
| 3 | 10 58 70 94; |
| 4 | 20 100) |
| 5 | GanttChart(label+horizontal+shadow;;15) |
| 6 | /* Set up styles. */ |
| 7 | |
| 8 | |
| 9 | FillStyle(3;#cbdb29) |
| 10 | |
| 11 | ShadowStyle(all;2 2 5) |
| 12 | LabelStyle(1;;;bold;white) |
| 13 | /* Set up axes. */ |
| 14 | ScalingOptions(y;on) /* y-scale top to bottom. */ |
| 15 | |
| 16 | AxisMajorTicks(all;0) |
| 17 | /* Set up grid. */ |
| 18 | MajorGridLineWidths(all;all;0) |
| 19 | MajorGridLineWidths(y;x;0) |
| 20 | MajorGridLineWidths(x;y;0.25) |
| 21 |
